Innovative Torque Sensor Development
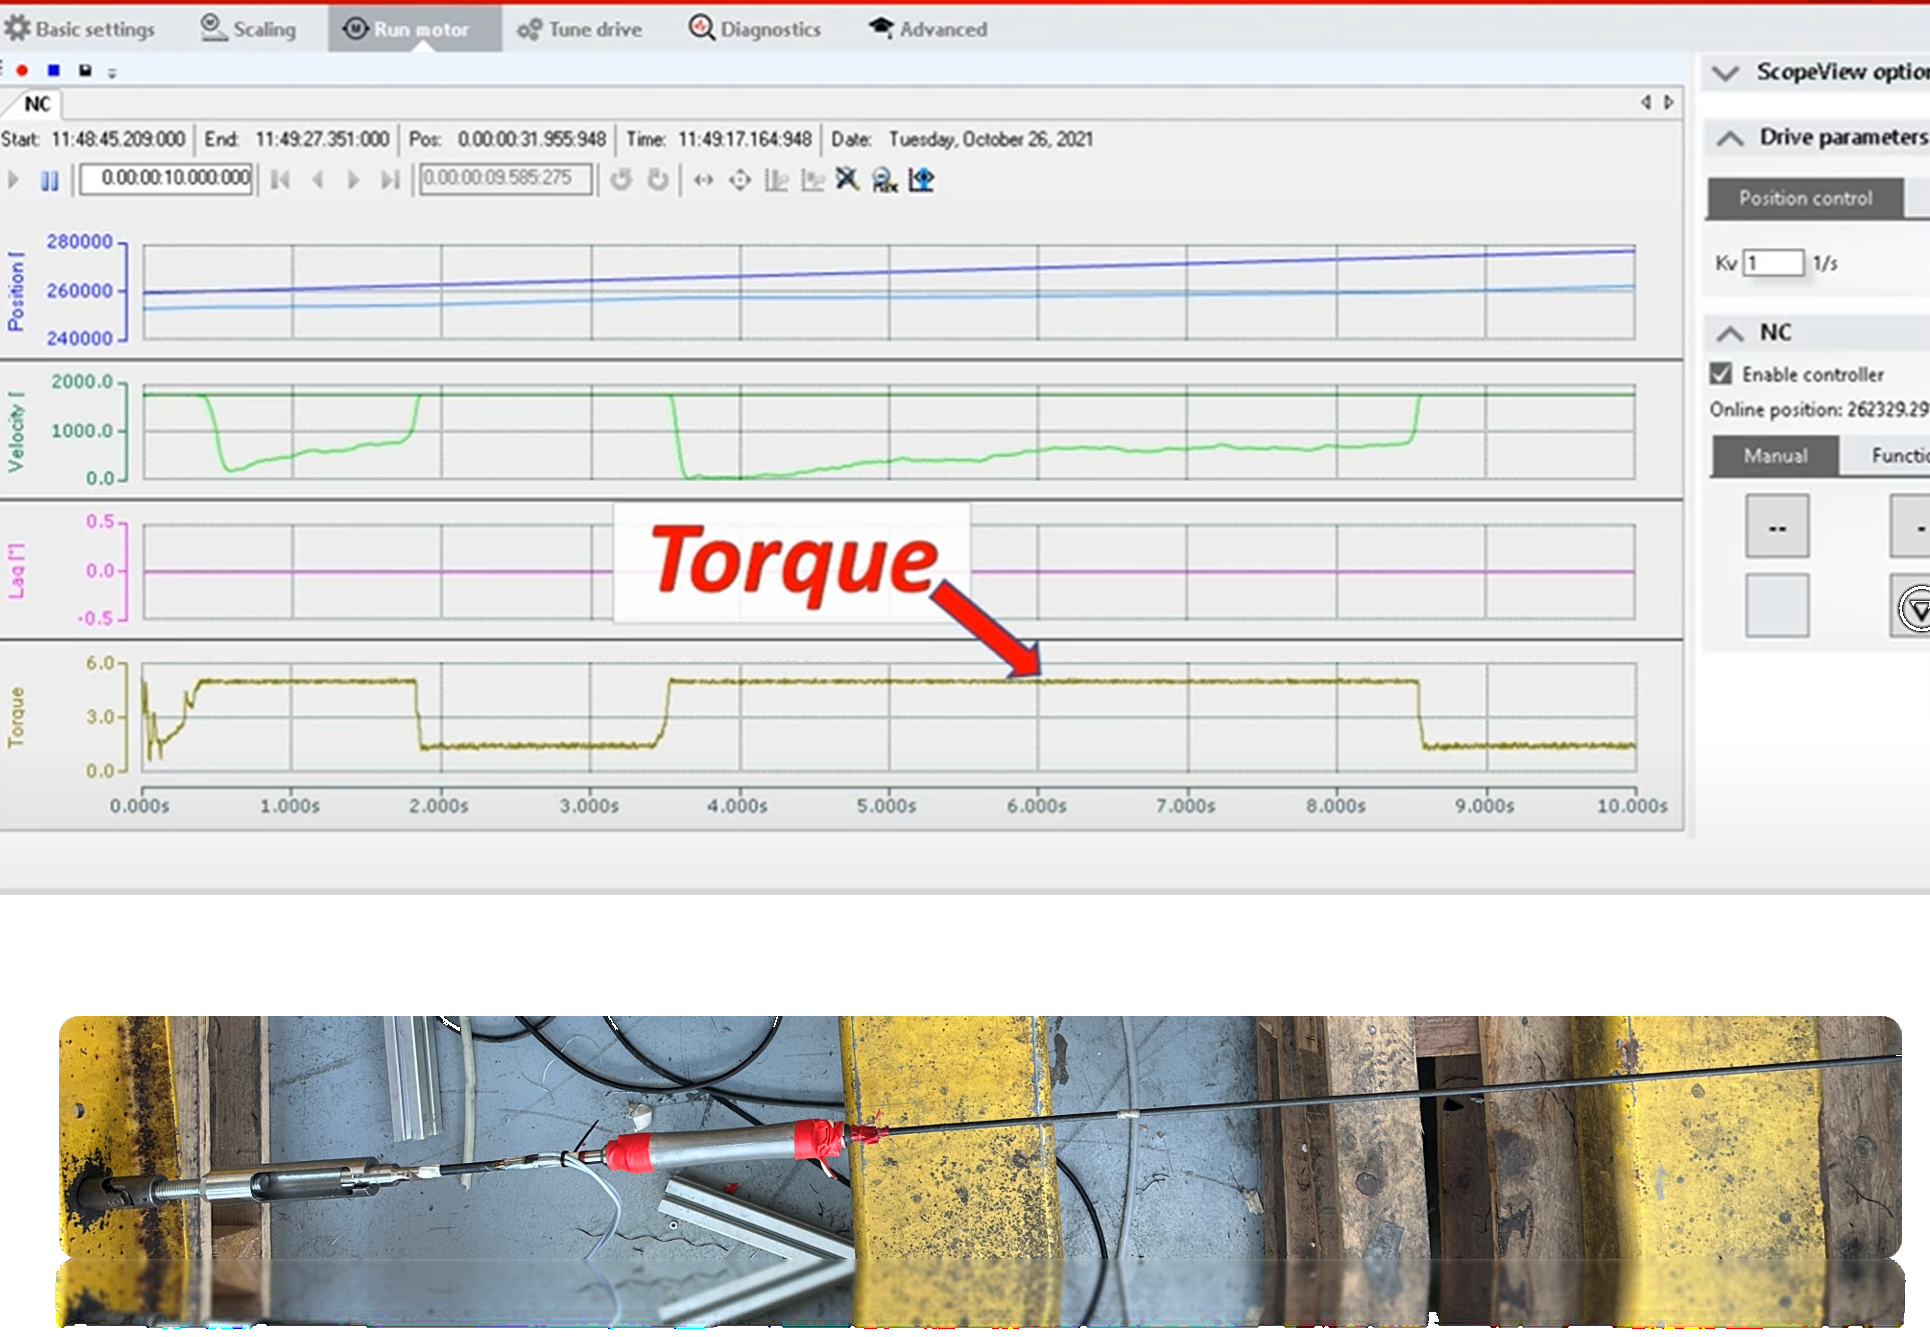
Case study · strain-gauge transduction & FPGA processing
Abstract
This case study documents the development of a purpose-built torque sensor for special machinery at SLB Group, undertaken because off-the-shelf sensors did not fit the available envelope and cost significantly more than an in-house solution. The work spans three engineering layers: the mechanical transduction of torque into measurable surface strain, the electronic signal chain (Wheatstone bridge, analog conditioning and FPGA-based real-time digital processing) that converts that strain into a calibrated digital torque reading, and an automated calibration procedure that establishes traceable measurement accuracy against a reference bench.
Introduction & objectives
Torque measurement on the target machinery required a sensor that fit inside an existing shaft envelope, met the necessary accuracy and bandwidth for real-time control, and was significantly cheaper than a commercial in-line torque transducer of equivalent specification. Meeting all three simultaneously required a custom design rather than an off-the-shelf part, structured around three objectives:
- Mechanical transduction — size a shaft section so applied torque produces a surface strain large enough to measure reliably without exceeding the material’s allowable stress.
- Electronic signal chain — condition the strain-gauge bridge signal and digitize and filter it in real time on an FPGA with sufficient resolution and bandwidth for closed-loop control use.
- Traceable calibration — establish the sensor’s transfer function and accuracy against a certified reference bench through a repeatable, automated procedure.
Theoretical background
Torque-to-strain transduction
For a shaft of circular cross-section under pure torque T, the shear stress at radius r is given by the torsion formula, where J is the section’s polar second moment of area:
Pure torsion is a state of pure shear, whose principal stresses lie at ±45° to the shaft axis, with magnitude equal to the shear stress itself. Using Hooke’s law for the principal strain and the standard relation between shear modulus G, Young’s modulus E and Poisson’s ratio ν (G = E/2(1+ν)), the principal strain measured by a gauge aligned at 45° to the shaft axis reduces to a strikingly simple expression:
This relation is the mechanical transfer function of the sensor: it is what converts an applied torque into a strain that a gauge bonded at 45° can measure directly, and it fixed the shaft diameter through the allowable-stress sizing check J ≥ Tmaxr/τallow used during mechanical design.
Wheatstone bridge signal transduction
Strain is converted to a resistance change through the gauge factor GF, defined as the normalized resistance change per unit strain:
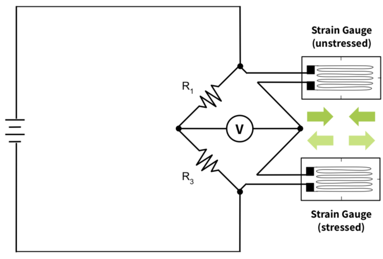
Four gauges — two pairs at +45° and −45° — were arranged in a full Wheatstone bridge. For small resistance changes, the bridge output voltage normalized by the excitation voltage Vex is:
Because the four gauges see equal and opposite torsional strain but identical thermal and axial/bending strain, this arrangement doubles the sensitivity to torque relative to a single active gauge while cancelling temperature drift and parasitic bending or axial loads — the two dominant sources of measurement error in a single-gauge design.
Digitization & real-time processing
The conditioned bridge signal was sampled well above the Nyquist rate for the torque signal’s bandwidth fmax,
with quantization resolution set by the ADC’s full-scale range FSR and bit depth n:
and smoothed on the FPGA with a real-time recursive low-pass filter,
whose coefficient a was tuned to remove electrical noise without introducing enough lag to compromise the control loop the sensor fed into.
Methodology
Design & development
The sensing section of the shaft was sized from the torsion formula of Equation (1) so that the maximum expected torque produced a working strain well within the gauge’s linear range while keeping shear stress under the material’s allowable limit. Four gauges were bonded at ±45° to the shaft axis and wired as the full bridge of Equation (3) to maximize sensitivity while rejecting bending, axial and thermal cross-sensitivity. Bridge excitation, instrumentation amplification and anti-alias filtering were implemented in analog front-end electronics feeding an FPGA, which performed synchronized sampling (Equation (4)), quantization (Equation (5)) and the real-time digital filter of Equation (6) to produce a clean, low-latency torque estimate.
Calibration & testing
The sensor was mounted on an HBM T12 reference torque bench and exercised across a series of known reference torques Ti, recording the corresponding filtered sensor output Vi. A calibration line was fit by ordinary least squares,
and the quality of fit was quantified with the coefficient of determination:
This calibration sweep, fit and R2 check were scripted as an automated routine so that recalibration after any hardware change required a single bench run rather than a manual data-reduction exercise.
Results & outcomes
The full-bridge configuration of Equation (3) provided the expected rejection of bending and thermal cross-sensitivity observed during bench trials, and the calibration fit of Equation (7) achieved a coefficient of determination close to unity across the working torque range, confirming a linear, well-characterized sensor response. Real-time filtering on the FPGA kept processing latency low enough for the sensor to be used directly in a closed control loop, and the in-house design met the mechanical envelope and cost target that ruled out available commercial alternatives.
Technical environment
Signal processing and FPGA logic were developed in MATLAB / Simulink using model-based design and HDL code generation. Calibration reference measurements were taken on an HBM T12 torque calibration bench, and system-level sequencing and integration testing used a Beckhoff PLC.
Nomenclature
| Symbol | Meaning |
|---|---|
| T, r, J | Applied torque, radius and polar second moment of area |
| τ, ε45 | Shear stress and 45° principal strain |
| E, G, ν | Young’s modulus, shear modulus, Poisson’s ratio |
| GF, ΔR/R | Strain-gauge factor and relative resistance change |
| Vout, Vex | Bridge output and excitation voltage |
| fs, fmax | Sampling frequency and signal bandwidth |
| FSR, n, LSB | ADC full-scale range, bit depth, quantization step |
| a | Recursive low-pass filter coefficient |
| m, b, R² | Calibration slope, intercept and coefficient of determination |
References
- R. G. Budynas and J. K. Nisbett, Shigley’s Mechanical Engineering Design, 10th ed., McGraw-Hill, 2014.
- HBM, Strain Gauge Measurement — A Tutorial, Hottinger Brüel & Kjær.
- C. E. Shannon, “Communication in the Presence of Noise,” Proceedings of the IRE, 1949.
- ISO 376, Metallic materials — Calibration of force-proving instruments, International Organization for Standardization.