Case study · cure kinetics, rheology & DoE optimization
Abstract
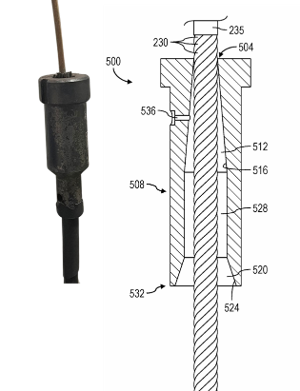
Composite wireline rope sockets rely on a resin/hardener system to transfer load between the cable’s reinforcement fibers and the metallic socket body. This case study documents the formulation and qualification of that resin system, combining reaction-kinetics and rheology characterization, thermal analysis (DSC/DMA), full-field strain measurement by digital image correlation (DIC), and a statistically designed experiment (DoE) used to optimize the formulation and cure profile against glass-transition temperature and mechanical robustness targets simultaneously.
Introduction & objectives
A rope socket resin must satisfy competing requirements: low enough viscosity to fully wet the fiber bundle during injection, a cure profile compatible with field/workshop process constraints, and a cured glass-transition temperature and toughness sufficient for the socket’s service loads and temperature range. Meeting all of these required moving beyond a single-factor-at-a-time approach to a structured characterization and optimization campaign, organized around three objectives:
- Process-window characterization — quantify cure kinetics and viscosity evolution well enough to define a working injection and cure-temperature window.
- Quantitative mechanical characterization — measure full-field strain during curing and loading with DIC rather than relying on point extensometry alone.
- Statistically optimized formulation — use a designed experiment to find the resin ratio and cure profile that jointly maximize glass-transition temperature and mechanical robustness, with a quantified confidence level rather than a single best-guess formulation.
Theoretical background
Cure kinetics & rheology
The temperature dependence of the epoxy–hardener reaction rate constant follows the Arrhenius relation,
and the evolution of the degree of cure α (0 at mix, 1 at full cure) was described with the Kamal–Sourour autocatalytic model, which captures the characteristic self-accelerating behavior of epoxy systems better than a simple n-th order model:
Viscosity build-up prior to gelation was likewise fit to an Arrhenius-type temperature dependence,
and the theoretical gel point — the conversion at which the resin transitions from a viscous liquid to a crosslinked, effectively infinite-molecular-weight network — was estimated from Flory–Stockmayer statistics as a function of the functionality of the epoxy and hardener, fA and fB:
Together, Equations (1)–(4) defined the usable injection window: the time available below a workable viscosity, at a given temperature, before the resin approaches αgel.
Thermal characterization
Residual reaction enthalpy measured by DSC gave a direct estimate of the achieved degree of cure for a given cure schedule,
and the resulting glass-transition temperature was related to conversion through the DiBenedetto equation, which interpolates between the uncured and fully cured glass transitions Tg0 and Tg∞ via a structure-dependent parameter λ:
This relation made it possible to predict the cured Tg from a partial-conversion DSC measurement, without needing to run every candidate formulation to full cure before comparing it.
Full-field strain measurement (DIC)
Digital image correlation tracks the deformation of a random speckle pattern applied to the specimen surface by finding, for each small image subset, the displacement p that best matches the reference and deformed images, i.e. that minimizes a sum-of-squared-differences correlation criterion:
The resulting displacement field was differentiated to obtain the in-plane Green–Lagrange strain components (e.g. εxx = ∂u/∂x), giving a full strain map during both curing shrinkage and mechanical loading rather than a single point value.
Design of Experiments & response-surface methodology
Formulation and cure-profile optimization used a second-order response-surface model relating a response y (glass-transition temperature or a mechanical robustness score) to the coded factors xi (resin:hardener ratio, cure temperature, cure time):
fit from a central composite design and assessed for statistical significance with the analysis-of-variance F-ratio of model to residual mean square,
with axial (star) points placed at a distance αcc = (2k)1/4 from the design center for a k-factor rotatable central composite design.
Methodology
Formulation & testing
Candidate resin:hardener ratios were characterized by rotational rheometry to fit the viscosity model of Equation (3), by isothermal and dynamic DSC to fit the cure-kinetics parameters of Equation (2) and to measure residual cure via Equation (5), and by DMA to cross-check Tg from the loss-tangent peak against the DSC/DiBenedetto prediction of Equation (6). DIC (Equation 7) was used throughout curing and subsequent mechanical loading to map strain fields non-invasively, catching localized effects (shrinkage-induced strain concentration, load-transfer gradients near the socket throat) that a single extensometer would have missed entirely.
Design of Experiments
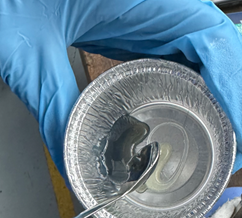
A central composite design was built over resin ratio, cure temperature and cure time, with glass-transition temperature and a mechanical robustness score as joint responses fit with the response-surface model of Equation (8) and checked for significance with the F-ratio of Equation (9). Because the two responses could not always be maximized simultaneously, the multiple responses were combined into a single desirability index D, the weighted geometric mean of per-response desirabilities di (each scaled 0–1 against its target):
and the formulation/cure-profile combination maximizing D was selected as the optimum, giving a single, traceable justification for the final formulation rather than a judgment call between competing candidates.
Validation
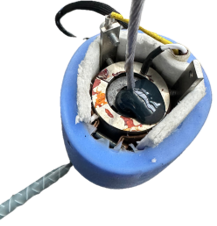
The optimum formulation was re-run at full scale and verified against simulated field loads (tension and thermal cycling representative of downhole service), with DIC-measured strain fields compared against the DoE model’s predicted robustness score, and repeatability confirmed across multiple mix batches before the formulation was released for qualification.
Results & outcomes
The Kamal–Sourour and DiBenedetto fits of Equations (2) and (6) predicted cured Tg from partial-cure DSC scans accurately enough to screen candidate formulations without curing every one to completion, substantially shortening the characterization campaign. The response-surface optimum identified by maximizing the desirability index of Equation (10) achieved a higher glass-transition temperature and mechanical robustness score than any single formulation tested outside the designed experiment, and DIC strain mapping confirmed the mechanical robustness of the optimum formulation under simulated field loading with repeatable performance across batches.
Technical environment
Viscosity and cure kinetics were characterized on a rotational rheometer and by DSC/DMA thermal analysis. Full-field deformation was measured with a digital image correlation (DIC) system. Design-of-experiments construction, response-surface fitting and desirability optimization were carried out in MATLAB / Python / R.
Nomenclature
| Symbol | Meaning |
|---|---|
| k(T), A, Ea | Rate constant, pre-exponential factor, activation energy |
| α, m, n | Degree of cure and Kamal–Sourour kinetic exponents |
| η, η0, Eη | Viscosity, pre-exponential viscosity, flow activation energy |
| αgel, fA, fB | Gel-point conversion and reactant functionalities |
| ΔH | DSC reaction enthalpy (residual / total) |
| Tg, Tg0, Tg∞, λ | Glass-transition temperature terms (DiBenedetto) |
| εxx | In-plane normal strain from DIC |
| β0, βi, βij | Response-surface regression coefficients |
| F, MS | ANOVA F-ratio and mean squares |
| D, di, wi | Overall / individual desirability and response weight |
References
- M. R. Kamal and S. Sourour, “Kinetics and Thermal Characterization of Thermoset Cure,” Polymer Engineering & Science, 1973.
- P. J. Flory, Principles of Polymer Chemistry, Cornell University Press, 1953.
- A. T. DiBenedetto, “Prediction of the Glass Transition Temperature of Polymers,” Journal of Polymer Science B, 1987.
- M. A. Sutton, J. J. Orteu and H. Schreier, Image Correlation for Shape, Motion and Deformation Measurements, Springer, 2009.
- G. E. P. Box and K. B. Wilson, “On the Experimental Attainment of Optimum Conditions,” Journal of the Royal Statistical Society B, 1951.
- G. Derringer and R. Suich, “Simultaneous Optimization of Several Response Variables,” Journal of Quality Technology, 1980.